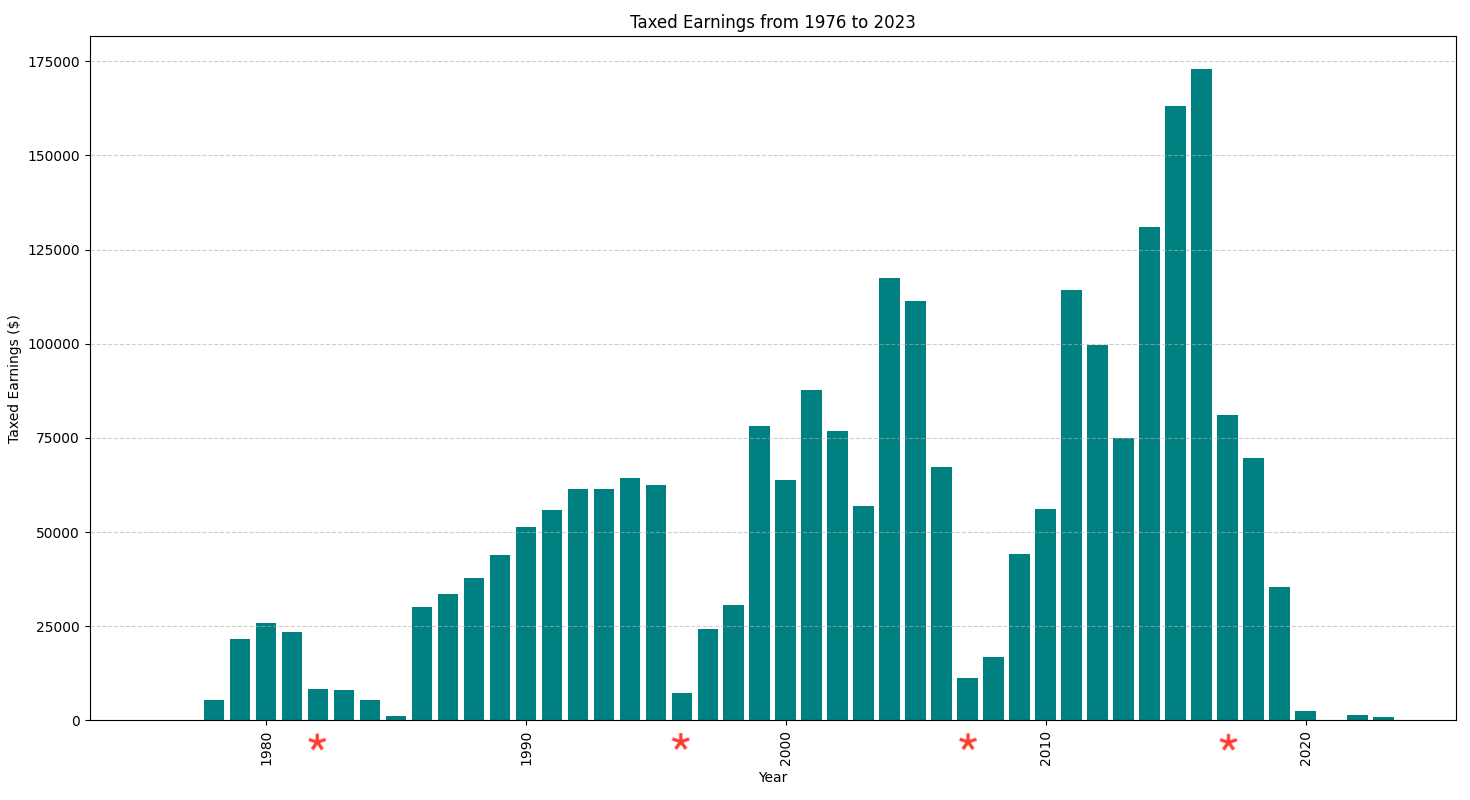
Year  Taxed Earnings
1976         0
1977         0  Moved back to California from east coast.
1978     5,298
1979    21,538  Work at Amdahl
1980    25,900
1981    23,393  At UCSC for 2nd B.A. for 3 years.
1982     8,391  Summer job at Amdahl
1983     8,113
1984     5,460  Traveling for 9 months.
1985     1,153  Traveling
1986    30,000  Santa Cruz Operation (SCO)
1987    33,434
1988    37,857
1989    43,769
1990    51,300
1991    55,830
1992    61,338
1993    61,315
1994    64,381
1995    62,386
1996     7,218  Laid off, began living at MMC
1997    24,260  Back to house in Santa Cruz
1998    30,644
1999    78,105  Brother and Father died.
2000    63,900
2001    87,606
2002    76,704
2003    56,853
2004   117,356
2005   111,385  Fired by Yahoo
2006    67,283
2007    11,272  Began rewrite of Reg
2008    16,708  Sister died.
2009    44,043  Went live with Reg
2010    56,203
2011   114,391  Moved to Redwood City
2012    99,666
2013    74,956
2014   130,977
2015   163,197
2016   172,998
2017    81,137  Retired but still consulting
2018    69,695
2019    35,489
2020     2,360
2021         0
2022     1,487
2023       976
Note the * years.
The nice bar graph was created by Python code that chatGPT generated for me.
And since I’m a geek 😊:
        Total         From      For
Year   Earnings        MMC     Babaji
====   ========        ===     ======
1981      23393          0          0
1982       8391          0          0
1983       8113          0          0
1984       5460          0          0
1985       1153          0          0
1986      30000          0          0
1987      33434          0          0
1988      37857          0          0
1989      43769          0          0
1990      51300          0          0
1991      55830          0          0
1992      61338          0          0
1993      61315          0          0
1994      64381          0          0
1995      62386          0          0
1996       7218          0          0
1997      24260          0          0
1998      30644        198          0
1999      78105        970          0
2000      63900         35          0
2001      87606          0          0
2002      76704          0          0
2003      56853        262          0
2004     117356        480          0
2005     111385       3283          0
2006      67283        520          0
2007      11272       7983          0
2008      16708      25645          0
2009      44043      47724          0
2010      56203      21729          0
2011     114391       3261          0
2012      99666       9475          0
2013      74956       8295          0
2014     130977       4837          0
2015     163197       7069       3000
2016     172998       2895      10700
2017      81137       8815       4000
2018      69695      16387       8000
2019      35489       6194          0
2020       2360       7135          0
2021          0          0          0
2022       1487          0          0
2023        976          0          0
2024          0          0          0
This bar graph I made all by myself.